Transit Planning
We regularly review and adjust our transit services as the city’s needs evolve. Doing so enables us to better serve our customers throughout Toronto. We're continually working to serve more people, provide new connections, reduce overcrowding and enhance customer experience within our current resources.
Managing the transit network involves developing policies, guidelines, and performance indicators for transit service. We apply this guidance in developing, evaluating, and implementing transit service changes.
Service Plans
We have completed a new 5-Year Service and Customer Experience Action Plan (2024-2028) that will provide strategic direction for TTC service and customer experience from 2024 to 2028.
Review the full plan: 5-Year Service and Customer Experience Action Plan, 2024-2028
The first 5-Year Service Plan & 10-Year Outlook (2020-2024) identified service-related improvements to public transit service in the city of Toronto and beyond.
As part of the 5-Year Service Plan (2020-2024) process, we committed to developing detailed Annual Service Plans (ASPs) every year. Learn more about the 2026 ANP and previous ASPs below:
- 2026 Annual Network Plan
- 2025 Annual Service Plan
- 2024 Annual Service Plan
- 2023 Annual Service Plan
- 2022 Annual Service Plan
- 2021 Annual Service Plan
Service Standards
Our Service Standards are a systematic and objective means of planning, monitoring, adjusting, and evaluating transit services throughout Toronto. The standards provide a mechanism for measuring the tradeoffs between the benefits achieved by providing more service in one location, the inconvenience caused by removing it from another, and the costs of providing those services.
The TTC is currently undertaking a review of the Service Standards. Find out more about the process here.
Service Summary
This is a technical document that summarizes the transit services operated by the TTC.
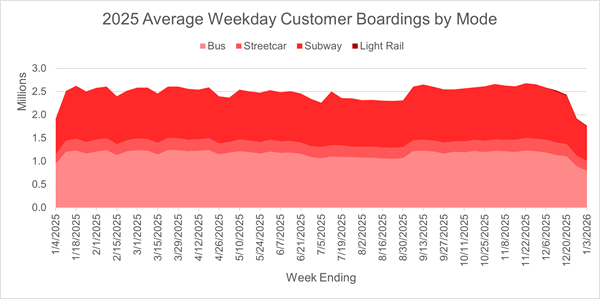
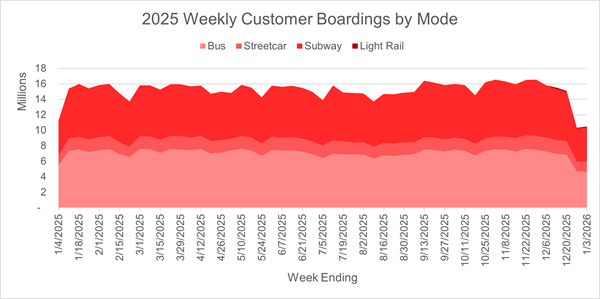
Customer Boardings
Boardings measure customer use of the system, by mode and by location. Customers are counted each time they board a TTC vehicle. The charts below summarize the average weekday and weekly boardings by mode in 2025.
| Year | Metrics | Bus |
Streetcar |
Subway | Light Rail | Scarborough RT | System Total |
|---|---|---|---|---|---|---|---|
| 2019 | Average weekday | 1,369,000 | 330,000 | 1,377,000 | N/A | 32,000 | 3,108,000 |
| 2019 | Average Saturday | 663,000 | 193,000 | 546,000 | N/A | 17,000 | 1,418,000 |
| 2019 | Average Sunday | 901,000 | 249,000 | 720,000 | N/A |
13,000 |
1,882,000 |
| 2019 | Annual total |
430,318,000 | 107,274,000 | 416,158,000 | N/A |
9,797,000 |
963,547,000 |
| 2020 |
Average weekday | 704,000 | 134,000 | 553,000 | N/A |
13,000 |
1,390,000 |
| 2020 |
Average Saturday | 495,000 | 108,000 | 325,000 | N/A |
7,000 |
928,000 |
| 2020 |
Average Sunday | 374,000 | 87,000 | 240,000 | N/A |
6,000 |
700,000 |
| 2020 |
Annual total |
225,636,000 | 44,511,000 | 170,725,000 | N/A |
3,927,000 |
440,895,000 |
| 2021 |
Average weekday |
633,000 | 114,000 | 463,000 | N/A |
11,000 |
1,210,000 |
| 2021 |
Average Saturday |
448,000 | 100,000 | 327,000 | N/A |
8,000 |
875,000 |
| 2021 |
Average Sunday |
346,000 | 77,000 | 245,000 | N/A |
6,000 |
668,000 |
| 2021 |
Annual total | 203,454,000 | 38,471,000 | 148,338,000 | N/A |
3,412,000 |
390,262,000 |
| 2022 | Average weekday |
877,000 | 194,000 | 732,000 | N/A |
17,000 |
1,821,000 |
| 2022 | Average Saturday |
597,000 | 173,000 | 520,000 | N/A |
12,000 |
1,303,000 |
| 2022 | Average Sunday |
466,000 | 131,000 | 387,000 | N/A |
9,000 |
993,000 |
| 2022 | Annual total |
279,647,000 | 65,799,000 | 234,701,000 | N/A |
5,525,000 |
585,672,000 |
| 2023 | Average weekday |
1,137,000 | 211,000 | 919,000 | N/A |
13,000* |
2,281,000 |
| 2023 | Average Saturday |
764,000 | 188,000 | 636,000 | N/A |
9,000* |
1,597,000 |
| 2023 | Average Sunday |
616,000 | 147,000 | 490,000 | N/A |
7,000* |
1,260,000 |
| 2023 | Annual total |
362,089,000 | 71,629,000 | 293,131,000 | N/A |
4,269,000 |
731,118,000 |
| 2024 | Average weekday |
1,214,000 |
233,000 |
1,056,000 |
N/A |
N/A |
2,503,000 |
| 2024 |
Average Saturday |
829,000 |
211,000 |
713,000 |
N/A |
N/A |
1,753,000 |
| 2024 |
Average Sunday |
665,000 |
163,000 |
540,000 |
N/A |
N/A |
1,369,000 |
| 2024 |
Annual total |
389,128,000 |
79,572,000 |
335,893,000 |
N/A |
N/A |
804,593,000 |
| 2025 | Average weekday |
1,164,000 |
246,000 |
1,079,000 |
20,000** |
N/A |
2,491,000 |
| 2025 |
Average Saturday |
777,000 |
229,000 |
707,000 |
40,000** | N/A |
1,713,000 |
| 2025 |
Average Sunday |
621,000 |
177,000 |
534,000 |
18,000** | N/A |
1,333,000 |
| 2025 |
Annual total |
369,942,000 |
84,242,000 |
340,065,000 |
460,000 | N/A |
794,709,000 |
* Average for days operating in 2023.
** Average for days operating in 2025.
Bus and Streetcar Usage
This table shows customer boardings and service information by route for 2019-2025.- 2019 weekday customer boardings and service information by route
- 2020 weekday customer boardings and service information by route
- 2021 weekday customer boardings and service information by route
- 2022 weekday customer boardings and service information by route
- 2023 weekday customer boardings and service information by route
- 2024 weekday customer boardings and service information by route
- 2025 weekday customer boardings and service information by route