2025 Operating Statistics
2. Conventional System
| Passenger Trips | 2025 | 2024 | Increase/ (Decrease) |
|---|---|---|---|
| Total | 413,068,000 | 419,861,000 | Decrease of 6,793,000 |
Note: Total excludes Wheel-Trans
| Type | 2025 | 2024 | Increase/ (Decrease) |
|---|---|---|---|
| Bus Routes | 167 | 162 | Increase of 5 |
| Streetcar Routes | 11 | 11 | 0 |
| Subway Lines | 3 | 3 | 0 |
| Light Rapid Transit Lines | 1 | 0 | Increase of 1 |
| Total | 182 | 176 | Increase of 6 |
Note: Column totals for 2025 exclude Community Bus service (6 routes), Blue Night Bus service (28 routes), Blue Night Streetcar service (7 routes), seasonal service (4 routes), and 1 suspended bus route.
| Type | 2025 | 2024 | Increase/ (Decrease) |
|---|---|---|---|
| Bus Routes | 5,807.8 | 5,680.2 | Increase of 127.6 |
| Streetcar Routes | 310.8 | 308.8 | Increase of 2 |
Note: Kilometres valued in this table include round trip length of routes and their branches along shared roadways. Increase in bus kilometres can be attributed to the various changes of branches for certain routes and introduction of new routes or branches with shorter distances to travel. Increase in streetcar kilometres can be attributed to changes introduced due to construction or maintenance projects (excludes Wheel-Trans).
| Line | 2025 | 2024 | Increase/ (Decrease) |
|---|---|---|---|
| 1 Yonge-University | 38.4 | 38.4 | 0 |
| 2 Bloor-Danforth | 26.2 | 26.2 | 0 |
| 4 Sheppard | 5.5 | 5.5 | 0 |
| 6 Finch West LRT | 10.4 | 0 | 10.4 |
Note: Subway/LRT lengths are given in one-way kilometres. Note: Line 6 officially opened to customers on Sunday, December 7, 2025.
| Mode | Passengers |
|---|---|
| Buses | 192,512,039 |
| Subway Trains | 185,531,129 |
| Streetcars | 34,916,228 |
| Light Rail Vehicles | 109,442 |
| Total | 413,068,838 |
Passenger Vehicle Fleet*
Note: These tables provide values for in-service vehicles only.
| Type | 2025 | 2024 | Increase/ (Decrease) |
|---|---|---|---|
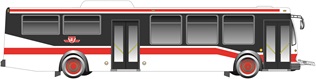
| Accessible 12-metre (40-foot) | 1,658 | 1,747 | Decrease of 89 |
| Accessible eBus 12-metre (40-foot) | 248 | 71 | Increase of 177 |
| Accessible 18.3-metre (60-foot) | 218 | 220 | Decrease of 2 |
| Total | 2,124 | 2,038 | Increase of 86 |
| Type | 2025 | 2024 | Increase/ (Decrease) |
|---|---|---|---|
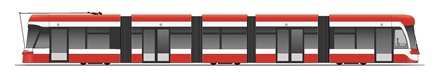
| Low-Floor Articulated | 264 | 233 | Increase of 31 |
| Total | 264 | 233 | Increase of 31 |
| Type | 2025 | 2024 | Increase/ (Decrease) |
|---|---|---|---|
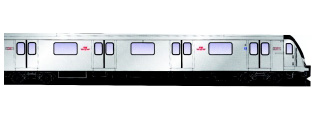
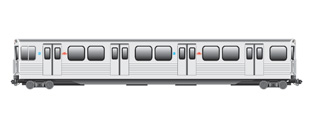
| Subway Cars | 848 | 848 | 0 |
| Total | 848 | 848 | 0 |
Note: All Subway trains are accessible. 368 T-1 subway cars are equipped with 1 multi-purpose area; 480 Toronto Rocket subway cars are equipped with 2 multi-purpose areas.
| Type | 2025 | 2024 | Increase/ (Decrease) |
|---|---|---|---|
| Low-Floor Articulated | 18 | 0 | Increase of 18 |
| Total | 18 | 0 | Increase of 18 |
| Vehicle | 2025 | 2024 | Increase/ (Decrease) |
|---|---|---|---|
| Bus | 143,560 | 140,407 | Increase of 3,153 |
| Subway | 84,207 | 81,363 | Increase of 2,844 |
| Streetcar | 11,150 | 10,435 | Increase of 715 |
| Light Rail Vehicle | 56 | 0 | Increase of 56 |
| Total | 238,973 | 232,205 | Increase of 6,768 |
* Includes in-service vehicles only.
** All Subway trains are accessible. 368 T-1 subway cars are equipped with 1 multi-purpose area; 480 Toronto Rocket subway cars are equipped with 2 multi-purpose areas.
*** Includes inside Toronto regular revenue services only.
Carrying Capacity (planned number of customers per vehicle)
TTC Bus: 35 seated; 51 maximum
TTC Articulated Bus: 46 seated; 77 maximum

TTC LFLRV: 70 seated; 130 maximum
TTC T1 Subway Car: 66 seated; 167 maximum (1,000 for a 6-car train)
TTC Toronto Rocket Car: 64-68 seated; 180 maximum (1,100 for a 6-car train)