2018 Operating Statistics
This page contains historical information for the year shown only and is not intended to reflect current TTC information.
2. Conventional System
| Passenger Trips | 2018 | 2017 | Increase/ (Decrease) |
|---|---|---|---|
| Total | 521,403,000 | 533,216,000 | (Decrease of 11,813) |
Note: Total excludes Wheel-Trans.
| Type | 2018 | 2017 | Increase/ (Decrease) |
|---|---|---|---|
| Bus Routes | 159 | 145 | Increase of 14 |
| Streetcar Routes | 10 | 11 | (Decrease of 1) |
| Subway Lines | 3 | 3 | 0 |
| ICTS (Scarborough RT Line) | 1 | 1 | 0 |
| Total | 173 | 160 | Increase of 13 |
Note: Column totals for 2018 and 2017 exclude Community Bus (6 routes), Blue Night Network (31 routes) and seasonal service (2 routes).
| Type | 2018 | 2017 | Increase/ (Decrease) |
|---|---|---|---|
| Bus Routes | 6,685.7 | 6,249.8 | 435.9 |
| Streetcar Routes | 347.4 | 344.3 | Increase of 3.1 |
Note: The kilometres valued in this table include round trip length of routes and their branches along shared roadways.
| Line | 2018 | 2017 | Increase/ (Decrease) |
|---|---|---|---|
| Yonge-University | 38.4 | 38.4 | 0 |
| Bloor-Danforth | 26.2 | 26.2 | 0 |
| Sheppard | 5.5 | 5.5 | 0 |
| Scarborough RT | 6.4 | 6.4 | 0 |
Note: Subway/Scarborough RT lengths are given in one-way kilometres.
ICTS = Intermediate Capacity Transit System.
| Mode | Passengers |
|---|---|
| Bus | 264,535,858 |
| Subway Trains | 216,736,775 |
| Streetcars | 35,865,779 |
| Scarborough RT Trains | 4,264,942 |
| Total | 521,403,354 |
Passenger Vehicle Fleet
Note: These tables provide values for in-service vehicles only.
| Type | 2018 | 2017 | Increase/(Decrease) |
|---|---|---|---|
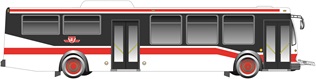
| Accessible 12-metre (40-foot) | 1,857 | 1,767 | Increase of 90 |
| Accessible 18.3-metre (60-foot) | 153 | 153 | 0 |
| Total | 2,010 | 1,920 | Increase of 90 |
| Type | 2018 | 2017 | Increase/ (Decrease) |
|---|---|---|---|
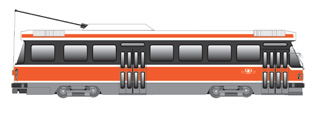
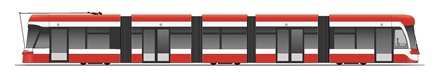
| New Low-Floor Articulated (LFLRV) | 117 | 57 | Increase of 60 |
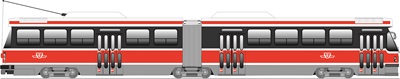
| Canadian Light Rail Vehicle (CLRV) | 113 | 141 | (Decrease of 28) |
| Articulated Light Rail Vehicle (ALRV | 15 | 43 | (Decrease of 28) |
| Total | 254 | 241 | Increase of 4 |
| Type | 2018 | 2017 | Increase/ (Decrease) |
|---|---|---|---|
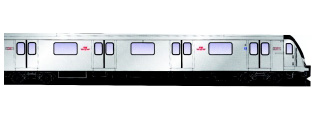
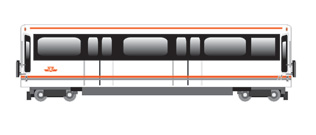
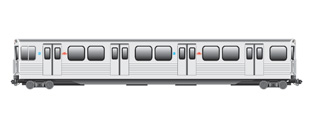
| Subway Cars | 848 | 848 | 0 |
| Scarborough RT Cars | 28 | 28 | 0 |
| Total | 876 | 876 | 0 |
Note: All Subway/RT trains are accessible. 368 T-1 subway cars are equipped with 1 multi-purpose area; 480 Toronto Rocket subway cars are equipped with 2 multi-purpose areas.
| Vehicle | 2018 | 2017 | Increase/ (Decrease) |
|---|---|---|---|
| Bus | 143,164 | 141,974 | Increase of 1,190 |
| Subway | 92,629 | 82,982 | Increase of 9,747 |
| Streetcar | 11,385 | 11,477 | (Decrease of 92) |
| Scarborough RT (ICTS*) | 3,435 | 3,402 | Increase of 33 |
| Total | 250,613 | 239,835 | Increase of 10,778 |
Note: Kilometres Operated include inside Toronto regular revenue services only.
ICTS = Intermediate Capacity Transit System.
Carrying Capacity (planned number of customers per vehicle)
TTC SRT Car: 30 seated; 55 maximum (220 for a 4-car train)
TTC Bus: 36 seated; 51 maximum
TTC CLRV: Car 46 seated; 74 maximum
TTC ALRV: 61 seated; 108 maximum
TTC LFLRV: 70 seated; 130 maximum
TTC T1 Subway Car: 66 seated; 167 maximum (1,000 for a 6-car train)
TTC Toronto Rocket Car: 64-68 seated; 180 maximum (1,080 for a 6-car train)