2020 Operating Statistics
This page contains historical information for the year shown only and is not intended to reflect current TTC information.
2. Conventional System
| Passenger Trips | 2020 | 2019 | Increase/ (Decrease) |
|---|---|---|---|
| Total | 224,998,000 | 525,470,000 | Decrease of 300,472,000 |
Note: Total excludes Wheel-Trans
| Type | 2020 | 2019 | Increase/ (Decrease) |
|---|---|---|---|
| Bus Routes | 146 | 163 | Decrease of 17 |
| Streetcar Routes | 9 | 11 | Decrease of 2 |
| Subway Lines | 3 | 3 | 0 |
| ICTS (Scarborough RT Line) | 1 | 1 | 0 |
| Total | 159 | 178 | Decrease of 19 |
Note: Column totals for 2020 exclude Community Bus (5 routes), Blue Night Network (27 routes) and seasonal service (1 route), a suspended streetcar route and several bus routes, mostly consisting of express routes (13 routes).
| Type | 2020 | 2019 | Increase/ (Decrease) |
|---|---|---|---|
| Bus Routes | 5,996.3 | 6,866.7 | Decrease of 870.4 |
| Streetcar Routes | 328.9 | 354.4 | Decrease of 25.5 |
Note: The kilometres valued in this table include round trip length of routes and their branches along shared roadways.
| Line | 2020 | 2019 | Increase/ (Decrease) |
|---|---|---|---|
| Yonge-University | 38.4 | 38.4 | 0 |
| Bloor-Danforth | 26.2 | 26.2 | 0 |
| Sheppard | 5.5 | 5.5 | 0 |
| Scarborough RT | 6.4 | 6.4 | 0 |
Note: Subway/Scarborough RT lengths are given in one-way kilometres.
ICTS = Intermediate Capacity Transit System.
| Mode | Passengers |
|---|---|
| Buses | 115,870,553 |
| Subway Trains | 84,605,245 |
| Streetcars | 22,658,882 |
| Scarborough RT Trains | 1,864,242 |
| Total | 224,998,902 |
Passenger Vehicle Fleet*
Note: These tables provide values for in-service vehicles only.
| Type | 2020 | 2019 | Increase/ (Decrease) |
|---|---|---|---|
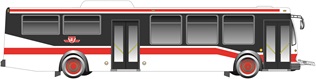
| Accessible 12-metre (40-foot) | 1,902 | 1,944 | Decrease of 42 |
| Accessible eBus12-metre (40-foot) | 60 | 0 | Increase of 60 |
| Accessible 18.3-metre (60-foot) | 152 | 152 | |
| Total | 2,114 | 2,096 | Increase of 18 |
| Type | 2020 | 2019 | Increase/ (Decrease) |
|---|---|---|---|
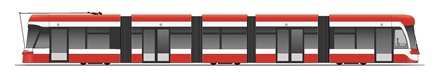
| New Low-Floor Articulated (LFLRV) | 204 | 198 | Increase of 6 |
| Total | 204 | 198 | Increase of 6 |
| Type | 2020 | 2019 | Increase/ (Decrease) |
|---|---|---|---|
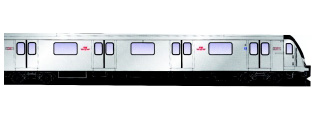
| Subway Cars | 848 | 848 | 0 |
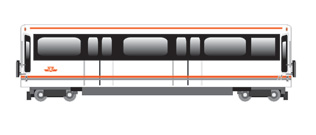
| Scarborough RT Cars | 28 | 28 | 0 |
| Total | 876 | 876 | 0 |
Note: All Subway/RT trains are accessible. 366 T-1 subway cars are equipped with 1 multi-purpose area; 480 Toronto Rocket subway cars are equipped with 2 multi-purpose areas.
| Vehicle | 2020 | 2019 | Increase/ (Decrease) |
|---|---|---|---|
| Bus | 131,559 | 144,060 | Decrease of 13,501 |
| Subway | 84,999 | 93,455 | Decrease of 8,456 |
| Streetcar | 9,897 | 11,845 | Decrease of 1,957 |
| Scarborough RT (ICTS*) | 3,284 | 3,500 | Decrease of 216 |
| Total | 229,739 | 253,869 | Decrease of 24,130 |
* Includes in-service vehicles only.
** All Subway/RT trains are accessible. 366 T-1 subway cars are equipped with 1 multi-purpose area; 480 Toronto Rocket subway cars are equipped with 2 multi-purpose areas.
*** Includes inside Toronto regular revenue services only.
* Intermediate Capacity Transit System.
Carrying Capacity (planned number of customers per vehicle)
TTC SRT Car: 30 seated; 55 maximum (220 for a 4-car train)
TTC Bus: 36 seated; 51 maximum
TTC LFLRV: 70 seated; 130 maximum
TTC T1 Subway Car: 66 seated; 167 maximum (1,000 for a 6-car train)
TTC Toronto Rocket Car: 64-68 seated; 180 maximum (1,080 for a 6-car train)